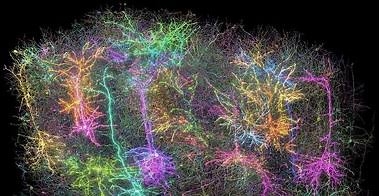
Scientists have created the largest functional map of a brain to date, and it’s all thanks to a mouse watching The Matrix.
The researchers used a part of the rodent’s brain, which reportedly is the size of a poppy seed, to map how the animal communicates through 84,000 neurons. The incredible map, which features the animal’s communication using “branch-like fibres through a surprising 500 million junctions called synapses”, resembles the visuals of galaxies that the space agencies often share.
“It definitely inspires a sense of awe, just like looking at pictures of the galaxies,” one of the project’s lead researchers, Forrest Collman of the Allen Institute for Brain Science in Seattle, said.
“You get a sense of how complicated you are. We’re looking at one tiny part… of a mouse’s brain and the beauty and complexity that you can see in these actual neurons and the hundreds of millions of connections between them,” Collman added.
Clay Reid, an Allen Institute scientist, said, “You can make a thousand hypotheses about how brain cells might do their job but you can’t test those hypotheses unless you know perhaps the most fundamental thing – how are those cells wired together.”
Where was the study published?
The researchers published the massive dataset in the journal Nature. The 3D reconstruction colour-coded research data is open to all, including other scientists who want to use it to advance their research.
How was the map created?
Over 150 researchers from Baylor College of Medicine, Allen Institute, and Princeton University were involved in creating the brain map. They started by showing various clips to a mouse, including snippets from sci-fi movies, sports, animation and nature. The researchers used a genetically engineered mouse whose “neurons glow when they’re active”.
As the next step, the researchers used a “laser-powered microscope to record how individual cells in the animal’s visual cortex lit up” while processing the images from the videos.
Following these, a small piece of the mouse’s brain tissue was analysed and pictured, and the data was constructed in 3D. Finally, the scientists painted the “individual wires a different color” using AI.


